Strategy
Using BLS and Census data for hospitality marketing in Texas
Hospitality guest engagement in Texas can be benchmarked with BLS employment data and Census Service Annual Survey figures for marketing ROI planning.
What to take away
- Hospitality guest engagement in Texas can be sized with public labor data before any campaign spend is committed.
- The Quarterly Census of Employment and Wages gives county level employment and wage totals for hotels and restaurants in Austin, Houston and every other Texas metro.
- The Occupational Employment and Wage Statistics tables break those totals into front desk, housekeeping, food preparation and service roles.
- The Census Service Annual Survey adds revenue and payroll figures that wage data alone cannot supply.
- Marketing ROI benchmarking works by dividing campaign cost by the guest volume that a metro's establishment count and staffing can plausibly support.
- Every one of these datasets lags reality by months, so use them for structure and ratios, not for this week's decisions.
Which BLS and Census datasets matter for Texas hospitality marketing
The Bureau of Labor Statistics employment data is the cheapest research you will ever run. It costs nothing, covers every Texas county, and is published on a fixed schedule you can plan campaigns around.
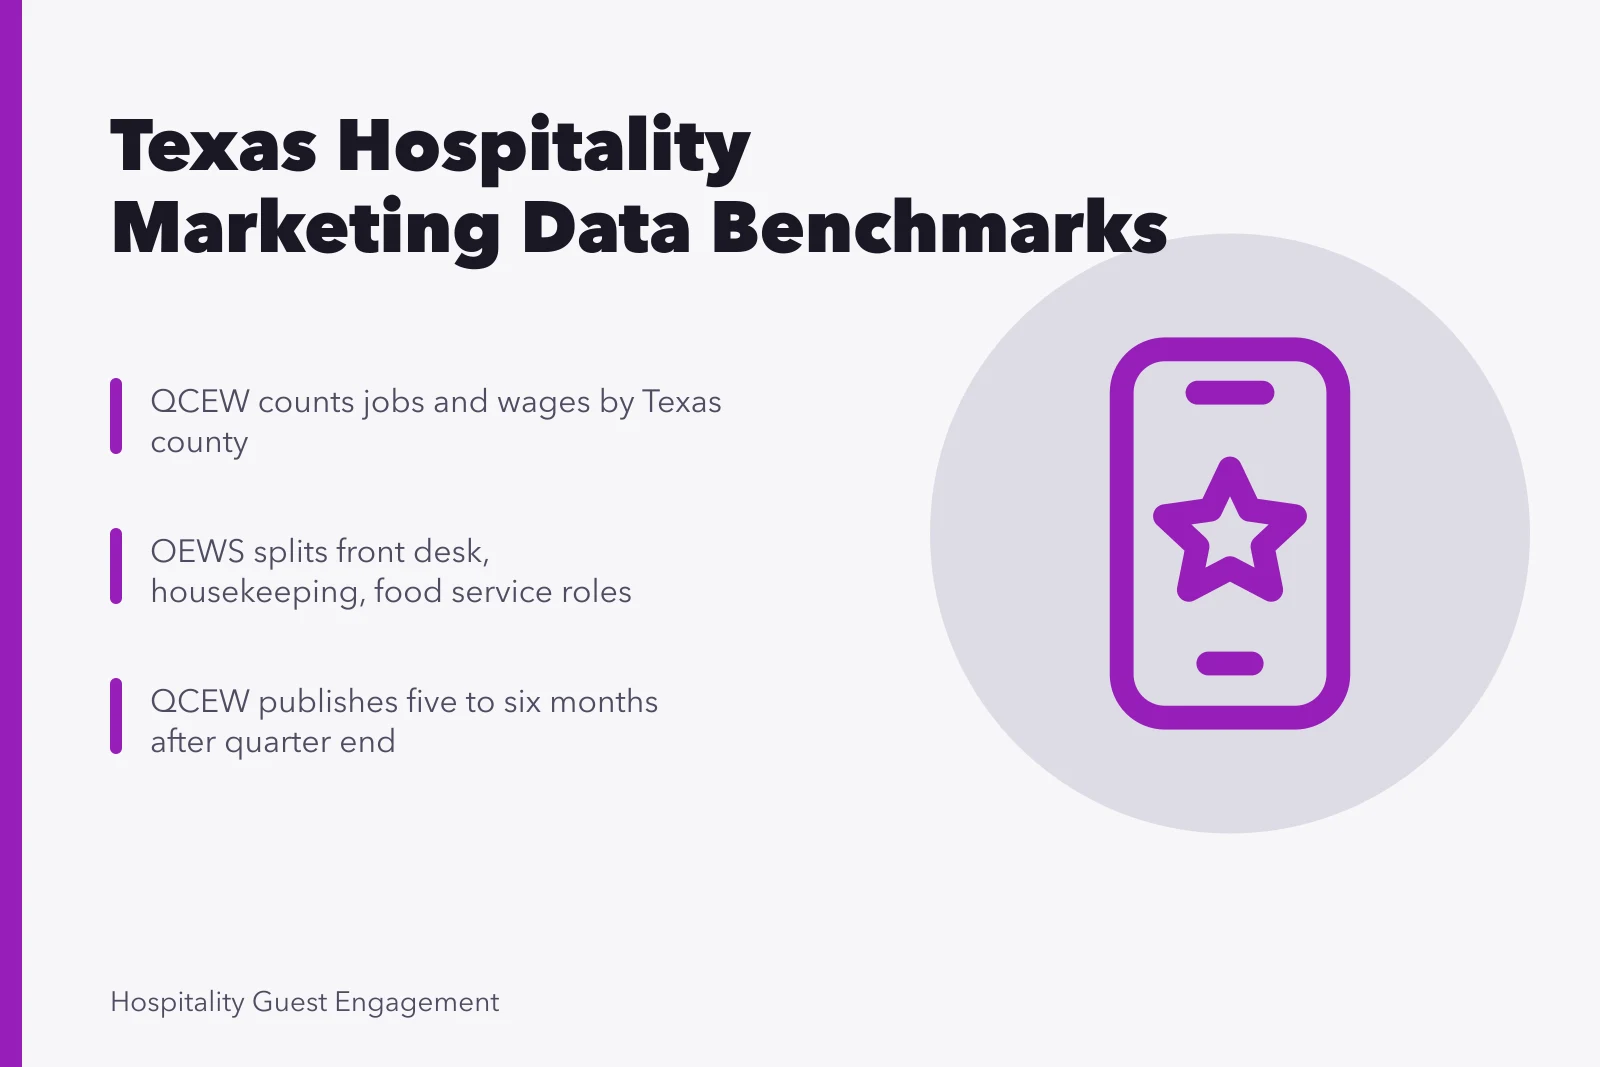
The core product for hospitality is the Quarterly Census of Employment and Wages. QCEW counts jobs and wages by industry and by county, drawn from unemployment insurance filings, so it reflects nearly every hotel and restaurant payroll in Texas rather than a sample.
The full program is described at the Quarterly Census of Employment and Wages, including the industry and area files you can download as spreadsheets.
For role level detail, turn to the Occupational Employment and Wage Statistics program. OEWS reports employment and wages by occupation within an industry, which is how you learn what a food preparation worker or a lodging manager earns in a given metro.
The OEWS tables cover the food preparation and serving occupations as a group, and the same site publishes lodging and front desk occupations separately.
If you need a map of everything available before you start pulling files, the BLS industry statistics overview lists the programs that touch accommodation and food services. The BLS geography statistics overview does the same for state, metro and county cuts, which is what makes Texas metro comparisons possible.
The Census Service Annual Survey is the other half of the picture. It reports revenue, payroll and expenses for employer firms in accommodation and food services, at national and state level, on an annual basis.
Labor data tells you how many people work in Texas hospitality. The Service Annual Survey tells you roughly how much money moves through those establishments.
One caution before you cite anything. Terms like employment, payroll and establishment have precise definitions inside these programs, and a loose paraphrase will get you corrected in a client meeting. The BLS glossary settles those definitions quickly.
What each dataset is actually good for
| Dataset | Publisher | Geography | Frequency | Best use for marketing |
|---|---|---|---|---|
| QCEW | Bureau of Labor Statistics | County, metro, state | Quarterly | Sizing employment and wage base by metro |
| OEWS | Bureau of Labor Statistics | Metro and state | Annual | Role level wage comparisons |
| Service Annual Survey | U.S. Census Bureau | State and national | Annual | Revenue and payroll context |
| Current Employment Statistics | Bureau of Labor Statistics | Metro and state | Monthly | Short term hiring direction |
| Local Area Unemployment Statistics | Bureau of Labor Statistics | County and metro | Monthly | Labor supply and turnover pressure |
Reading QCEW and OEWS figures for Austin and Houston
Austin and Houston behave differently enough that a single Texas campaign rarely fits both. The data shows why.
Austin vs Houston Hospitality Profile
Austin
- Property mix
- limited service, boutique
- Demand driver
- leisure and events
- Food service
- bars, breweries
- County
- Travis
Houston
- Property mix
- broader, flatter
- Demand driver
- business and conventions
- Food service
- large resident base
- County
- Harris
Austin's accommodation sector leans toward limited service and boutique properties tied to leisure and event demand, with a large share of food service employment attached to bars, breweries and fast casual concepts around downtown and the east side.
Houston's hospitality employment is broader and flatter, spread across a sprawling metro with a heavy business travel and convention base and a restaurant scene that serves a much larger resident population.
QCEW county files let you compare Travis County with Harris County directly. You can see total employment in accommodation and food services, average weekly wages, and how those numbers move quarter to quarter.
A rise in average weekly wage in a county usually means either higher paid roles are being added or hours are expanding, and both readings matter when you set a cost per acquisition target.
OEWS adds the role detail. If you are selling a scheduling or tip pooling tool, the count of waiters and waitresses in the Houston metro is your addressable market. If you are selling a guest messaging platform, the count of hotel front desk staff in the Austin metro is the number that sets your pricing ceiling.
Sub metro geography matters too. QCEW publishes at county level, and the Austin and Houston metros each contain several counties with different employment profiles. Pulling the whole metro into one average hides the difference between a downtown cluster and a suburban corridor, which is exactly the difference a geo targeted campaign depends on.
Before you build anything on these numbers, read them against the hospitality guest engagement software benchmarks your team already tracks, so the labor data is anchored to something you can act on.
A worked comparison
Suppose you want to know whether Austin or Houston supports a higher price point for a guest engagement platform sold per property.
- Download QCEW county files for Travis and Harris counties, accommodation and food services.
- Note total employment and average weekly wage for each.
- Pull OEWS metro tables for front desk and food service roles in both metros.
- Compare the ratio of wage to employment in each metro.
- Multiply average weekly wage by an assumed platform fee as a share of labor cost.
- Sanity check the result against your own closed deals in each market.
If Houston shows more establishments at a lower average wage, a per seat price will underperform there while a flat per property price may hold. That is the kind of conclusion the data supports.
Benchmarking guest engagement and marketing ROI against wage data
Marketing ROI benchmarking starts with a denominator you did not invent. Wage and employment data gives you one.
The method is straightforward. Take the total employment in accommodation and food services for your target county from QCEW. Multiply by an assumed share of staff who touch guest communication, which for most full service hotels is front desk, concierge and food and beverage. That gives you a seat count.
Divide your campaign cost by that seat count to get a cost per reachable seat, then compare it to the value of a retained guest.
The value side needs your own numbers, and this is where internal reporting does the heavy lifting. If you want a structured way to assemble those figures, the guide on common hospitality marketing strategy questions walks through which inputs are worth collecting and which are noise.
Wage data also sets a floor on what a guest engagement tool can cost. If average weekly wage for front desk staff in a Texas metro is a known figure, a platform that costs more per seat than a meaningful fraction of that wage will struggle in a sales conversation.
The wage number is public, so your prospect already knows it.
For restaurants, the same logic runs on covers rather than rooms. Employment counts for food preparation and serving roles give you a rough sense of daily cover capacity when combined with typical shift patterns. That capacity estimate is the ceiling on any campaign promising incremental traffic.
The ROI benchmarking method in steps
Cost Per Reachable Seat Method
- Pull county accommodation and food employment
- Multiply by guest-facing staff share
- Get reachable seat count
- Divide campaign cost by seats
- Compare to retained guest value
This is not a forecast. It is a way to keep a campaign proposal inside the bounds of what a Texas market can actually absorb.
If you want a second reference point for the guest side of the ratio, the hospitality marketing analytics notes on reading your own numbers with a sceptical eye are a useful counterweight to any labor data you pull.
Turning employment trends into campaign timing decisions
Employment data is a lagging indicator, but the lags are consistent, which makes it useful for timing.
QCEW Publication and Seasonal Timing
- Quarter endsdata collected
- 5-6 months laterQCEW published
- SpringAustin festival season builds
- AutumnAustin second peak
- Year roundHouston convention bumps
QCEW publishes roughly five to six months after the end of a quarter. That means a hiring surge visible in the data is already several months old by the time you see it. The value is not in reacting to it but in confirming a pattern you suspected from your own pipeline.
Seasonal patterns in Texas hospitality are strong and repeatable. Austin employment in accommodation and food services tends to build into spring festival season and again in the autumn. Houston shows a flatter curve with convention driven bumps. If your campaign calendar ignores those shapes, you are paying for attention in months when the audience is already saturated.
Hiring pressure is the more actionable signal. When QCEW shows employment rising faster than the seasonal norm in a county, properties there are likely short staffed and receptive to tools that reduce front desk workload. When employment is flat or falling, the pitch shifts to cost control and retention.
For restaurants, the timing question is simpler. Employment growth in food service occupations in a metro usually precedes expansion of new locations, and new locations need marketing support in their first two quarters. Watching OEWS and QCEW together gives you a rough early signal about where that expansion is heading.
Set your campaign calendar against these patterns, then layer your own guest loyalty marketing targets on top so the timing decision has a number attached to it.
A simple timing table
| Signal in the data | Likely market condition | Reasonable campaign move |
|---|---|---|
| Employment rising above seasonal norm | Staffing strain | Lead with workload reduction |
| Average weekly wage rising | Higher value guests or roles | Test premium offers |
| Employment flat, wage flat | Stable, mature market | Focus on retention |
| Employment falling | Cost pressure | Lead with efficiency claims |
Limits of the data and how to avoid overreading it
Every one of these datasets has a boundary, and crossing it quietly is how bad strategy gets built.
Data Limits to Check
- QCEW counts jobs, not people
- OEWS is a survey with sampling error
- Census SAS excludes smallest firms
- Metro definitions change over time
- No guest sentiment or booking data
QCEW counts jobs, not people. A worker holding two hospitality jobs appears twice. In a metro with heavy part time and seasonal work, that inflates the apparent size of the workforce, and any seat count built on it will be too high.
OEWS is a survey, not a census. It carries sampling error, and for smaller metros the margins are wide enough that a year on year change may be noise. Treat metro level OEWS figures as directional unless the change is large.
The Census Service Annual Survey covers employer firms above a size threshold, so it excludes the smallest operators. In a state with as many independent restaurants as Texas, that leaves a meaningful share of the market outside the revenue figures.
Geography is another trap. Metro definitions change, and county level QCEW data does not always align with how a marketing team defines its territory. If your sales regions are drawn along highway corridors rather than county lines, you will need to map one to the other before comparing anything.
Finally, none of this data says anything about guest sentiment, review scores or booking behavior. It describes the supply side of Texas hospitality, not the demand side. Use it to size and time your work, then measure the results with your own hospitality marketing strategy development benchmarks rather than assuming the labor data predicted them.
A short checklist before you publish a number
- Confirm the definition of every term you use against the BLS glossary.
- State the geography explicitly, county or metro, not just the city name.
- Note the reference period and the publication lag.
- Flag whether the figure is a count of jobs or a count of people.
- Say whether the source is a census or a survey.
- Avoid comparing an annual figure with a quarterly one without adjustment.